FORMING LIMIT DIAGRAM (FLD) OR FORMING LIMIT CURVE (FLC)
FLD, often known as Forming limit diagram is used to predict the forming behavior of sheet
metal complex parts or deep drawn parts and it attempt to provide a graphical
representation of the material failure tests or some lab experimental database.
To measure the material failure (Crack), the round blank is deformed/drawn to
make a Dome, with which two axis – Major and minor axis are derived from the repetitive
tests on different specimen of same material coil.
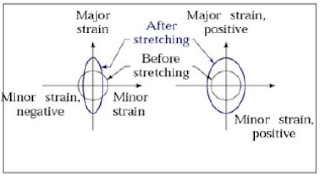
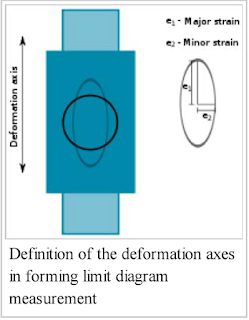
The ellipse in forming limit diagram consisting of two axis known as major and minor axis, used to predict the behavior of material under different forming conditions, where the role of geometry/shape has a vital significance. In the above geometry, there is a vertical forming, represented by major axis as well as horizontal stretching representing minor axis. The forming limit diagram in derived from the overall forming operation under the given conditions. Where there are multiple variable factors, out of which more important are - the material properties particularly N and R value and shape of the geometry you are going to choose as a stage to achieve the final goal, that is your product.
N = Strain hardening exponent, which measures the stretch ability of the material
R = Plastic strain ratio, measures the draw ability of the material
When the material is formed, both axis in combined form generate the Forming limit diagram.
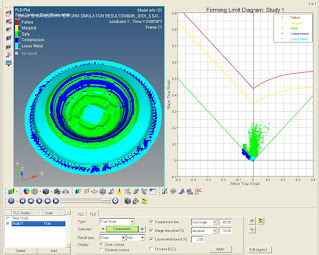
The material defects such as cracks and thinning are predicted by the major axis and winkles are predicted by the minor axis. The experimental data of the Forming limit diagram is used by the many FEA (finite element analysis) software to predict the forming behavior of different material under different geometrical conditions.
Different Material Grades have Different Forming Limit Diagram (FLD)
Different Material have variable values on Cupping
Dome test, which are shown in the under-given table. The three main categories
of materials are derived –
1. Type EDD (Extra deep draw quality) : used for lower
thickness and more deep drawn shapes.
2. Type DD (Deep draw quality) : used for lower
thickness and Intermediate deep drawn shapes.
3. Type D (Draw quality) : used for Heavy thickness
and Less deep drawn shapes with draft angles.
Mechanical properties of the material Affecting Forming Limit Diagram (FLD)
The certain mechanical properties like Strain
hardening exponent and plastic strain ratio are greatly influencing the Forming limit diagram (FLD) curve.
Usually greater the n-value (Ranging from 0.14~0.24),
the material is more stretchable and more prone to deep draw.
How Forming Limit Diagram (FLD) is generated
Why Forming Limit Diagram (FLD) is important for Industry
Some Engineering service providers are using this data for generating input Forming limit diagram (FLD) curves for their FEA software packages such as LS Dyna, Autoform, Pamstamp, Hyperworks etc. More accurate is FLD data is, more precise the results are. These software's are helping the industry with pre-determination of results are often called Virtual analysis i.e the draw process prediction in the cad stage right before mfg. The defects such Wrinkles, Cracks, Thinning, Thickening are analysed in advance, helps to boost the development and lowers the cycle time as well as money investment.I have personally used these Cad packages to solve the process related problems by designing for virtual process before going forward directly to tooled up process, therefore eliminating the number of trials from 15 to 3 numbers for more complicated parts and from 4 to 2 or 1 number for less complicated geometries.
How FEA Helps by using Forming Limit Diagram (FLD)
Common Sheet Metal Defects arrested by FORMING LIMIT DIAGRAM (FLD)
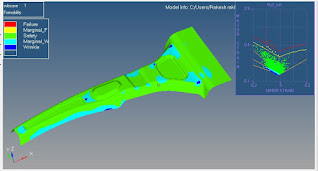
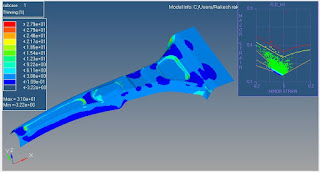
It calculates very clearly the material yielding areas such as spitting, necking/thinning, material compression (wrinkle or folds). The forming limit diagram (FLD) analyze data and plot the graph of each element's strain in both major and minor axis and compare the limits of the material to determine whether there is any such defects will probably be there while actual die try out.
Wrinkles : Wrinkling in a draw are series of ridges form radially in the drawn wall due to compressive buckling. Practically these are due to low blank holder pressure due to which material slips and wrinkles formed. The optimum blank holding pressure is the key, however in certain cases it doesn't work. Then draw beads are the solutions, the location and shape of draw bead is the challenge, which can be analysed with FEA prior to process design.
Cracks : Crack in the vertical wall due to high tensile stresses, some small radius block the material flow and results in excessive thinning at that point usually more than 40% of the sheet thk. result in cracks. In some cases it may happen due to excessive blank holder pressure, which restrict the metal flow. Somewhere it might be due to wrong process design, like try to make a more deep draws in a single stage, which otherwise feasible only in two stages.
Thinning : Excessive Stretching in the vertical wall due to high tensile stresses cause thickness reduction specifically on the small radius in the metal parts. The image highlights the thinning portions, however up to 20% thinning is allowed due to process limitations.
How FEA Helps by using Forming Limit Diagram (FLD)
The ultimate objective of the Forming simulation is to study the behavior of the material under given shape and forming conditions prior to stamping die manufacturing, that means up to 85% result prediction can be granted during design stage, saves valuable time and money invested in longer try out's. Nowadays FEA software's such as LS DYNA, AUTOFORM, HYPERFORM, PAMSTAMP are very good for virtual process simulations prior to product manufacturing. The defects such as Wrinkles, thinning and cracks can be seen in the design stage right just before the process design, results in correct process selection and reduction in lead time and save valuable money, which otherwise invested in hectic manufacturing iterations.
More accurate the input is, more accurate the results are. The mesh quality and size of the elements in the blank and rigid elements is quite more important, the other variants are the material properties assigned to the blank, the blank holding force, the ram speed, ram pressure. Apart from that there are other factors such as selection of right method, the coefficient of friction, the die punch and blank holder movement. The possible error in input may deteriorate your output results by 30%, the max. possible 85~90% accuracy is matched with the actual try out samples, when all inputs are furnished at expert level professionals.
If you want to learn the Metal forming simulation, read the book "Practical guide to forming simulation"
The book is available via. the following links.
Or
Buy from here at 20% discount.
Or
Or
Buy the book from Notion press
Or
Or
Or
Or
Or
SOME MORE HELPFUL TOPICS :
Bending Force Calculation
Forming Limit Diagram
Sheet Metal blank size calculation
Lean Manufacturing Terminologies
Brief Comparison of Hydraulic and Mechanical press
TECHNICAL TERMINOLOGY OF WHEEL TIRE
Raw material calculation of Complex Deep drawn Geometry
Modify the product to make it aesthetically better and more cost effective
How creativity results in major cost savings
How concrete analysis resolve warranty issues
Proud of being Granted with your first patent
How hastened decisions affect the business in the long term
How cost reduction is the key factor to capture the market share
How to choose number of Draw process for deep drawn geometry
Essential parts of a draw die
Everything about patent
sheet metal processing and latest trends
Electric vehicle (EV) – Future of Transport






0 Comments